


Data analytics and related terms such as data science, machine learning, big data and artificial intelligence (AI) have been the talk of the town for some time. We all know the showcase use cases from the media: AI is used to drive cars and beat the world's best chess and Go players. These use cases are both a curse and a blessing. Blessing, because they show how powerful the technologies are; curse, because they are often so detached from the actual problems in our daily work that in the end nothing concrete comes out.
In this article, I would therefore like to show how the use of data analytics methods and technologies can lead to great process simplifications, time savings and new insights. The focus is on a concrete example and less on a comprehensive treatment of the topic.
In this article, I would therefore like to show how the use of data analytics methods and technologies can lead to great process simplifications, time savings and new insights. The focus is on a concrete example and less on a comprehensive treatment of the topic.
Use Case: Missing link between data
Challenge:
Infrastructure assets are managed in different systems (ERP, GIS/NIS, etc.); however, the technical and financial views of the assets are not linked. This results in a lack of an overall view of the assets. Effective asset management, good network calculations, network monitoring and the evaluation of connection requests are not possible on this basis. Evaluations are therefore often only carried out on entire asset groups and key figures are often only rough averages without the possibility of going to asset level.
The biggest obstacle to linking the technical and financial views is often that the effort involved is very high: for larger plants, it can take from several hundred to a thousand man-days to perform this linkage. To make matters worse, this work requires a certain level of data understanding, and the relevant specialists are already well utilized.
Approach:We encountered exactly this problem at a Swiss infrastructure company. Using data analytics methods, we were able to show that the problem could be solved in a simpler and more cost-effective way. The most important principle in this use case is not to go for an all-or-nothing solution that has to cover all special cases with one algorithm. Rather, the goal is to complement the strengths of data analytics with the strengths of the specialists. In other words, the algorithm tries to match the data from the various databases. In cases where this is not clearly possible or the data quality is insufficient, the pre-analyzed data with a shortlist of possible matching partners is forwarded to a specialist. Now the expert can contribute his data knowledge and experience to match the more difficult cases for the algorithm. Time is saved in two ways: on the one hand, certain data no longer needs to be processed by specialists; on the other hand, the pre-processing and pre-selection of possible matching partners increases the efficiency of manual matching.
Process Data Analytics ©Eraneos Group AG
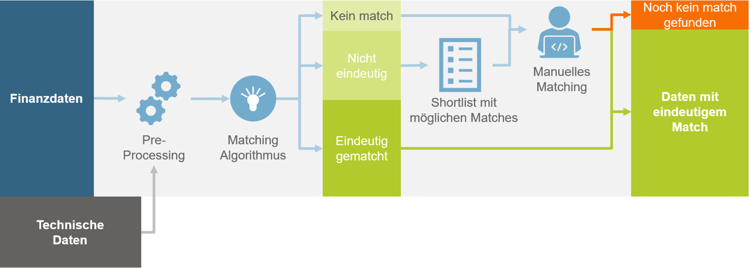
The process described is illustrated in Figure 1. On the left side, the data analytics tool is in use and on the right side, the experts come into play. The data analytics part includes two steps: pre-processing and the actual algorithm. In pre-processing, the data is read in from the systems, possibly supplemented with data from other data sources and put into the right format. This first step can already save a lot of work and replaces the manual pulling of reports from systems as well as reformatting and data juggling in Excel.
The matching algorithm was developed with input from experts. We used a mixture of geospatial analysis and natural language processing (NLP). The latter allows us to extract the important information needed for matching from free text fields.
A lot of effort can go into improving the matching algorithm with more logic and knowledge. Therefore, it is worthwhile to make effort/benefit considerations here. Already in the first run-up we achieved very good numbers in our project. We achieved about 50-60% unique matches, depending on the system type. In addition, we were able to match 15-30% almost unambiguously, i.e. we had a short list of a few "candidates" who were eligible as matching partners. In this manual matching, we support the specialist with a graphical user interface in which the matching partners are displayed in tabular form and, if possible, geographically. This allows a very time-saving work and leads to an enormous gain in efficiency.
The manual effort has been reduced by a factor of more than 3 with this approach, in our project this led to a cost saving of several hundred thousand Swiss francs - with the first version of the matching algorithm. We will sharpen it a bit more in one or two further iterations to further improve the results.
Other possible applications
The use case shown is, of course, far less spectacular than an artificial intelligence (AI) playing chess. In my opinion, the spectacular use cases are needed to generate attention for the topic and to trigger new visions. Equally, we need the less spectacular use cases to create acceptance and understanding of what these methods and technologies can actually do.
As an example, I would like to mention a few use cases that have already been successfully implemented:
As an example, I would like to mention a few use cases that have already been successfully implemented:
- Creation of dashboards to have the current KPIs and historical developments at hand at any time and thus make data-driven decisions. Relevant for all areas, especially for sales and asset management.
- In parallel or as a supplement to a dashboard, analyses can be performed directly on the data to identify developments and patterns and adjust processes on this basis.
- Analysis of existing operational data: for example, fault data from fault recorders is often available and can be easily analyzed with modern tools. Optimizations for operations and asset management can be derived from this.
- Analysis of time series data and creation of forecasts using machine learning, e.g. for balance group management or for energy production with PV systems and wind turbines.
Data Analytics: Hype Topic or Already Profitable? Lessons Learned
Yes, you already have enough data to perform analysis!
The vast majority of companies already have a data basis that is good enough to start with an analysis. It also makes sense to start by analyzing what you already have. That way, you can see the possibilities and adjust the data capturing and formats accordingly.
The vast majority of companies already have a data basis that is good enough to start with an analysis. It also makes sense to start by analyzing what you already have. That way, you can see the possibilities and adjust the data capturing and formats accordingly.

Infobox “Big Data”
Big Data refers to a large amount of structured and unstructured data. The more data there is, the easier it is to innovate business processes. Big data is the basis for machine learning.
You don't need a big data platform project to get started with data analytics!
Central data platforms make sense. But they are not a prerequisite for data analytics. You certainly already have interesting data that you can use without a central data platform. If the data is not yet standardized, this can be easily solved with the step described above (pre-processing). As soon as the first use cases have been successfully implemented, there will automatically be an appetite for more and it will be easier to justify the expense of a data platform.
Involving the business departments is essential!
In order to extract profitable information from data, it is imperative to have expertise and an idea of what you want to achieve. Eraneos's data analytics experts bring a lot of expertise to corresponding projects. But we always act together with our customers. By incorporating your specific expertise and vision, we create data analytics solutions that bring you tangible added value.
A certain data mindset is often present, while the tools and understanding of the possibilities are missing
How much data analytics is already being done varies greatly from business to business. It depends, among other things, on the size of the company, the data affinity of the employees and the department. In retail, for example, data analysis has been established for a long time. In practice, almost every company and every department now performs at least periodic Excel exports that are filtered or pivoted for analysis purposes. The positive thing about this is certainly that a basic understanding is available. Logic may also already be mapped. With the right tools, these processes can be made more efficient and error-resistant with little effort. For example, a BI tool can be used to map exports and logic, so that the most up-to-date analyses are always available at the push of a button.
Successfully reach your goal: start small and think in iterations!
Unfortunately, data projects often fail because people want to solve everything from scratch at the same time. That's why I'm a big believer in agile approaches. Start with your existing data. You don't need a big data project beforehand to do data analytics. In the beginning, focusing on making a partially automated solution productive is in most cases more promising than a fully automated solution that never makes it to production. After the solution is productive, it can be adapted and iteratively developed further with the insights gained from the application.
Data analytics and Big Data may be new. But tried-and-tested life lessons still apply in this environment: "The better is the enemy of the good".